Visible Light
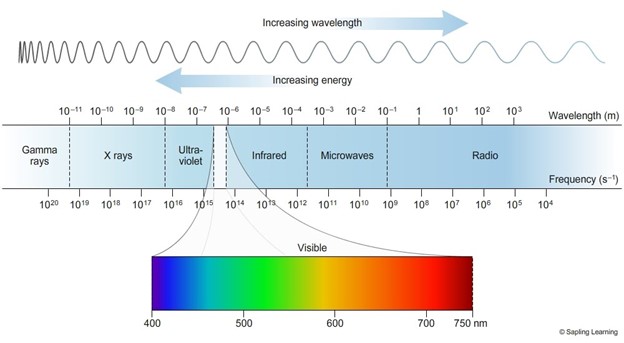
The electromagnetic spectrum that consists of waves of electromagnetic radiation vibrating at different frequencies. Human-visible light is a small part of of this electromagnetic spectrum. Unless otherwise stated, it is understood that the emission of this electromagnetic radiation is spatially uniform (spatially isotropic).
Some natural sources of visible light include the sun, fire, lightning, and fireflies. The first carbon arc lamp was invented in 1805[f]. The modern incandescent lightbulb was commercialized about 1920. When electricity is sent through the filament in an incandescent bulb, the filament heats up and emits about 3% of its energy as light and the rest as heat.
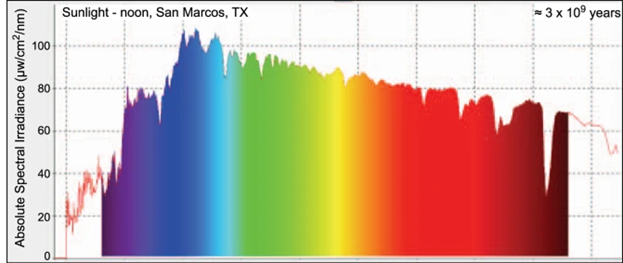
Most light sources contain more than one wavelength of light with varying intensities. The Spectral Power Distribution chart shows us the power distribution of each wavelength in the human visible spectrum. Figure 2 shows the SPD of the sun at noon. Because the intensity of each wavelength is about the same, we interpret the color as white.
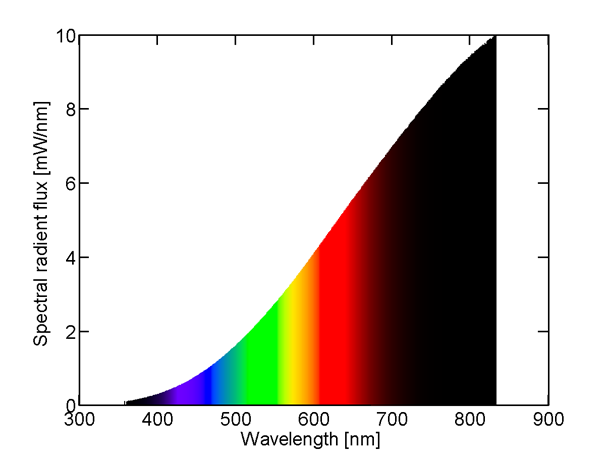
The spectral distribution of visible light from an incandescent lightbulb is shown in Figure 3. There is very little ultraviolet and blue wavelength light, with a smooth upward curve to majority red and infrared wavelengths. The visible part of the spectrum is from about 400nm to 700nm. We also perceive the color was white or yellowish-white because the majority of the wavelength power is nearer to the red end of the spectrum.
Tristimulus Theory
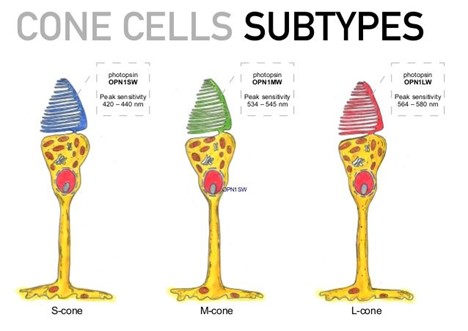
Human eyes contain three types of cells that react to light: rods, cones, and ganglion. The ganglion cells are used to regulate our circadian rhythms. The rods are shaped like a cylinder and they are mostly used to detect brightness. The cones are shaped like triangles and are used to detect color. Each of the three types of cone cells is most sensitive to light in a different region of the visible spectrum: the blue wavelengths at about 430nm, green at about 540nm and red at about 570nm.
Even though there are no yellow cones or purple cones, our brains can still detect those colors because of the additive properties of light. Our brain detects the different percentages of blue, red, and green and infers the color. For example, 50% red and 50% green and 0% blue results in a perception of yellow.
There are far more green and red cones than blue cones, but because the blue wavelength light is so much more energetic, the information sent to the brain regarding the colors is approximately the same.
Color Space
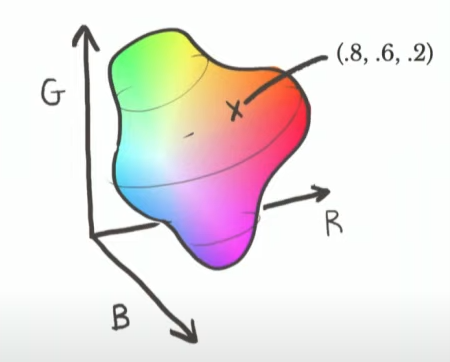
Some creatures have different configurations of cells. For example, a pigeon has 5 types of cone cells. So, when we speak about color, we are generally talking about how a human uses the 3 types of cone cells that are most sensitive to the blue, green and red wavelengths. We can then mix these 3 primary light colors together to get a brain-perceived color and we map this on a 3D graph, where each axis is labeled from 0 to 1 to indicate 0% to 100% of the possible intensity. Figure 5 shows this Color Space.
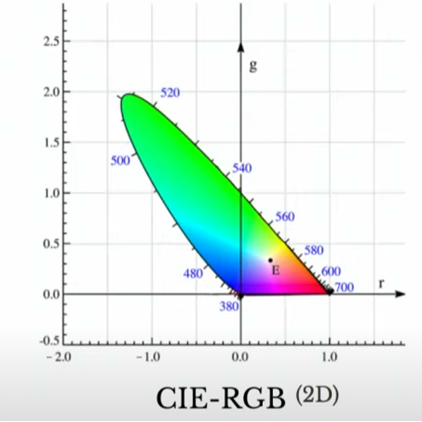
Using 3D to 2D mapping, we can also create a 2D color space that is easier to work with. Notice that there are negative values. This occurs because the 3 primary colors cannot combine to make all possible human-visible colors. However, we can add one primary color to the original color to create a new color. This is an abstract mathematical concept used only for the purpose of communicating color information.
Finally, to remove the negative values and make the color space easier to work with, mathematicians used a linear transformation process with abstract primary colors to convert the CIE-RGB color space into a positive-only color space called the XYZ color space. Values were set from 0 to 1, with white being at 1/3 and y-axis is aligned with brightness.
Figure 7 is called a Chromaticity Diagram. It is a two-dimensional representation of the three primary light colors (Red, Green and Blue). The outer edge are wavelengths of light that fall within the human visible spectrum and are pure colors. This graph is a 2D-slice of the 3D vectors of Red, Green and Blue from 0% to 100% (0 to 1). The additive result of these vectors, combined with the knowledge that combining two colors will make a third color, gives us this chart.[f]
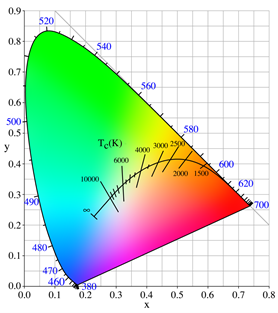
The purpose of the Chromaticity diagram is to communicate information about color using exact numbers instead of language such as “reddish”. The CIE-XYZ color space is a purely abstract concept designed around the biology of the human eye that contains 3 color sensing cones that are most sensitive to blue, green, and red wavelengths.
Color Rendering Index
The Color Rendering Index is a scale that has a top value of 100. Sunlight at noon is used as the reference source light and is assigned the value 100. If a light source has a CRI of 100, this means that the light source produces the same colors natural sunlight. It is possible to have a CRI of less than 0.
A typical white light LED has a CRI around 75. Since the typical white light LED is a blue LED plus yellow phosphor, it is an engineering challenge to be able to manipulate the LED to reach high CRI above 95.
The best CRI is not always 100 since the lighting depends on the application and what emotional mood is being set. For productive work during the day, a light that mimics the full spectrum of daylight might be best choice. However, if the light is to be used outdoors at night when humans would normally be using rod cells to see and blue wavelength light should not exist, it may make more sense and may be safer for human health to have a lower CRI that would better match the rod cells.